Plan import in minutes
Paste the shift plan straight from your Excel sheet: line, shift, model, SKU and target quantity. No retyping, no new planning tool to learn.
Services Shopfloor data & MES
Manufacturing Execution System
mfosys.in MES puts your production plan next to the output your machines actually count. Supervisors see which line is falling behind while there is still time in the shift to recover it, not in tomorrow’s report.
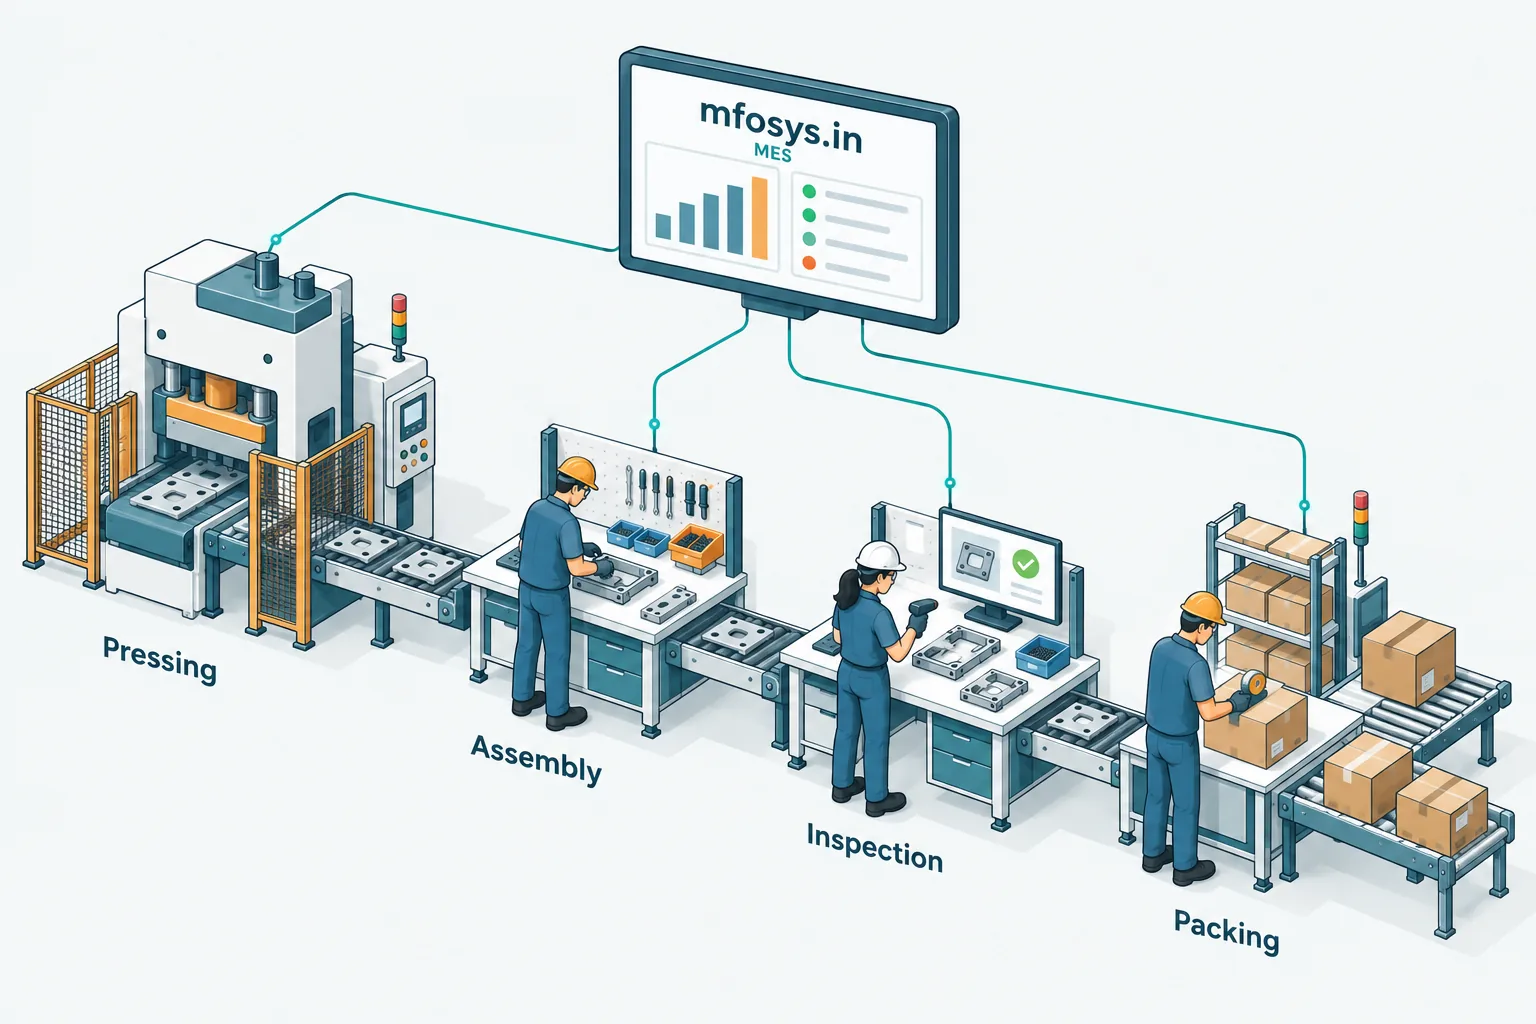
Most plants already have a plan and a production register. The trouble is the gap between them, and how late it shows up.
Built around lines, stages and shifts, the way Indian MSME plants already plan and report production.
Paste the shift plan straight from your Excel sheet: line, shift, model, SKU and target quantity. No retyping, no new planning tool to learn.
Every planned slot with its actual output, status and achievement, filled in by the machines rather than by hand.
See each hour of the shift against its share of the target, so a slow start is visible by 10 a.m., not at 4 p.m.
Availability, performance and quality, calculated the same way for every machine and line, with each factor shown alongside the total.
Good and rejected counts at each counted stage show first-pass yield, and where in the line the losses are happening.
Units waiting between stages are shown on the line diagram. The biggest queue points to the bottleneck.
When output falls short, the likely cause (machine, quality or manpower) is suggested from the data, and supervisors can override it.
Move from a company view to a plant, a line and a single machine, with the same definitions at every level.
A large-screen view for the shopfloor, rotating between lines, so the whole team can see where the shift stands.
We start where the gap between plan and actual hurts most, prove the numbers, then extend.
Talk about your first lineTogether we define your lines, stages, shifts and what counts as good output at each stage.
Machine signals, PLC counters or barcode scanners report output. We validate the counts against your register before anyone relies on them.
Your planning team keeps working in Excel and pastes the shift plan in. Targets appear on the board immediately.
Use the board in daily production meetings. Add lines, stages and plants as the team gets value from it.
Wherever parts are counted through stages and planned by shift, the MES fits.
No. Your planners keep their sheet and paste it into the MES. Actual, balance and achievement columns are filled in from machine data, so nobody types them.
OEE = availability × performance × quality. Availability comes from when the machine is reporting, performance from output against the planned rate, and quality from good against total counts. Each factor is shown, so the total is never a black box.
Yes. A line can mix machine stages, operator stations and scanner points. Stations without a counter still appear in the line, and a repair loop can be modelled separately from the main flow.
Yes. Shifts are defined per line in your local time, including night shifts that run past midnight.
We scope each project around what you already have. Where machines can’t report, our machine data and automation teams can add the connection.
One team for the shopfloor: each service connects to the others when your project needs it.
Let’s look at your plan
Send us a sample shift plan and tell us how many lines and stages you run. We’ll shape a free demo around your production, not a generic factory.
The demo is free, at no cost and with no commitment.